Results and Discussions
DynEval is evaluated against 14 existing evaluation methods on 11 text-to-image benchmarks. We report Spearman Rank Correlation Coefficient (SRCC) and Pearson Linear Correlation Coefficient (PLCC) between predicted evaluator scores and human annotations; higher values indicate stronger agreement with human judgment. DynEval is trained entirely without human annotations, yet it generalizes across diverse benchmark settings.
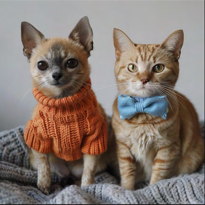
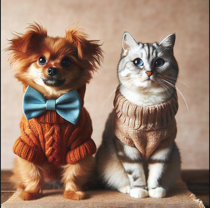
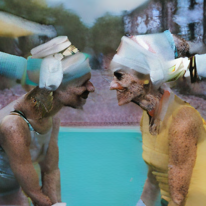
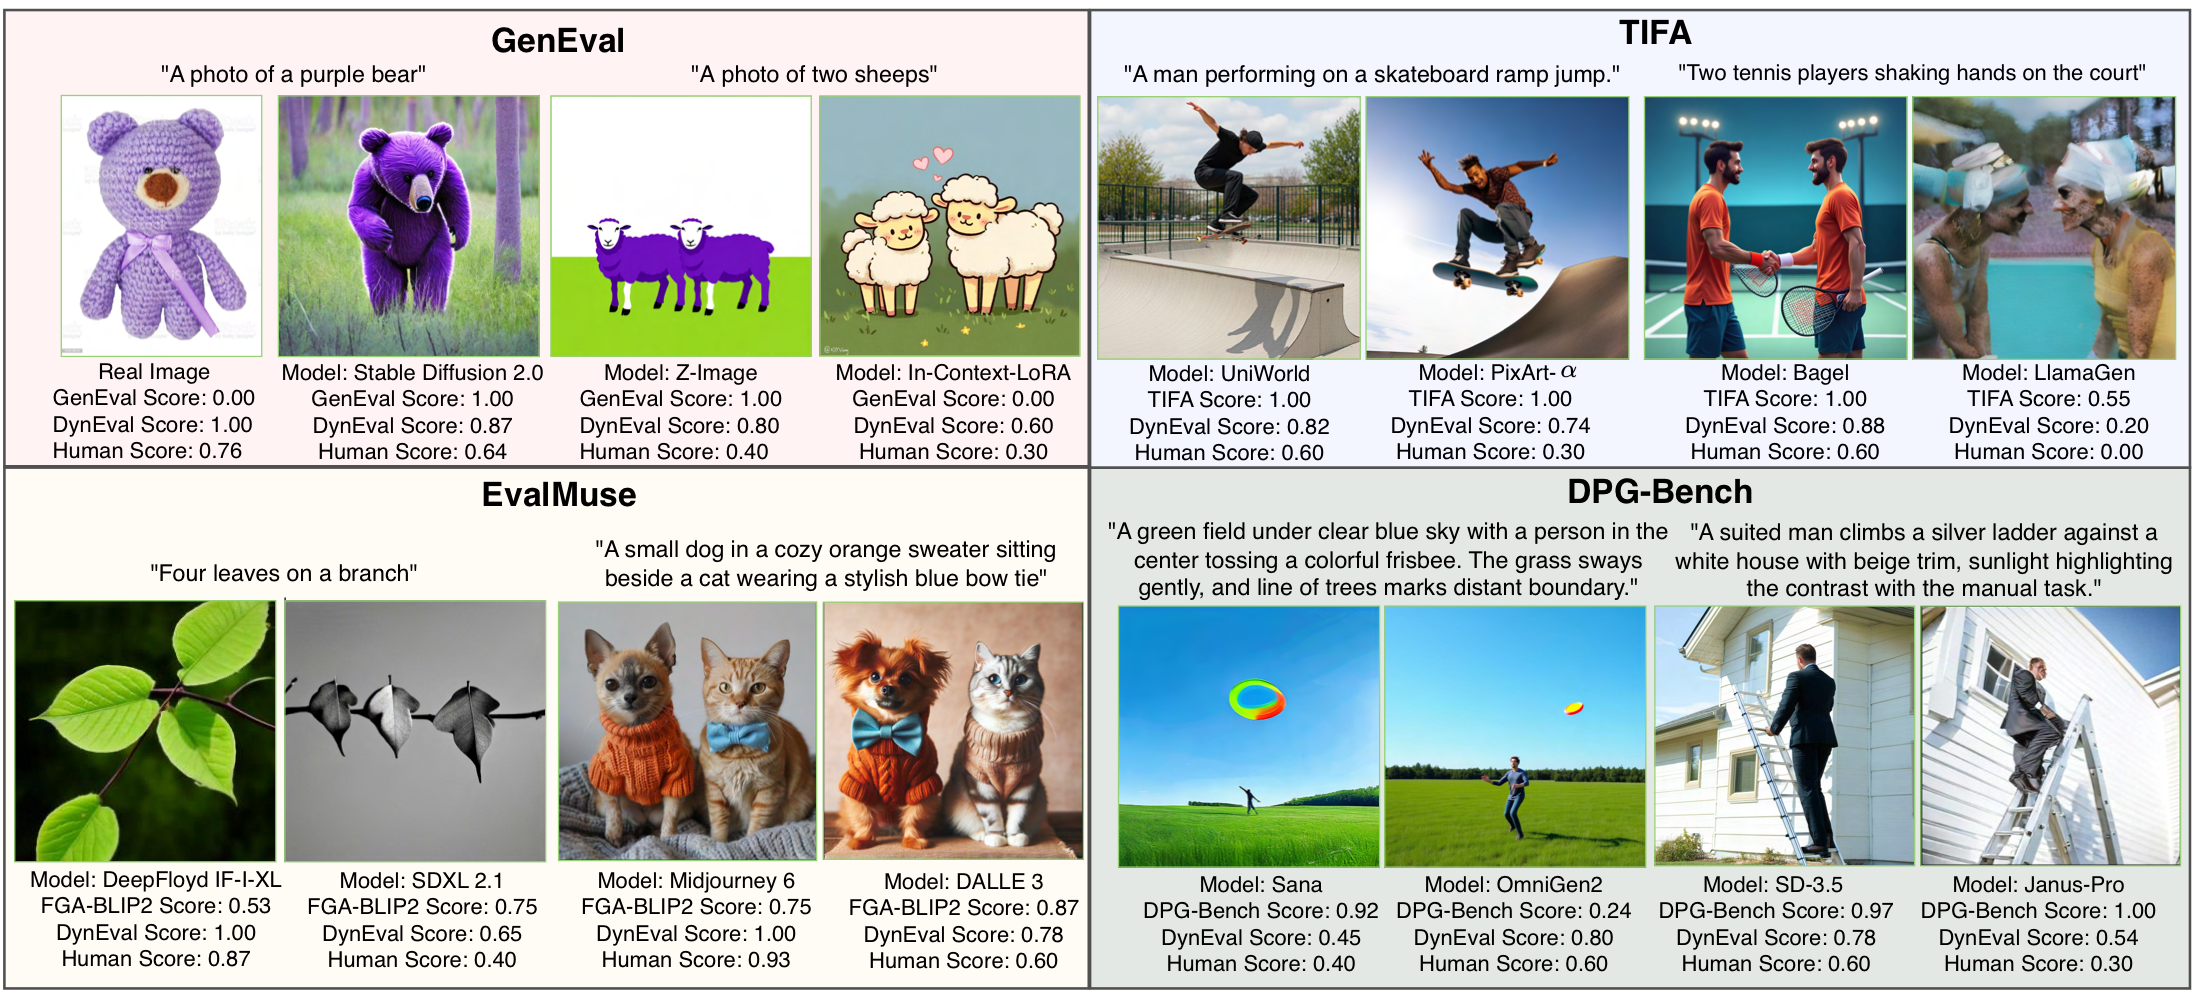
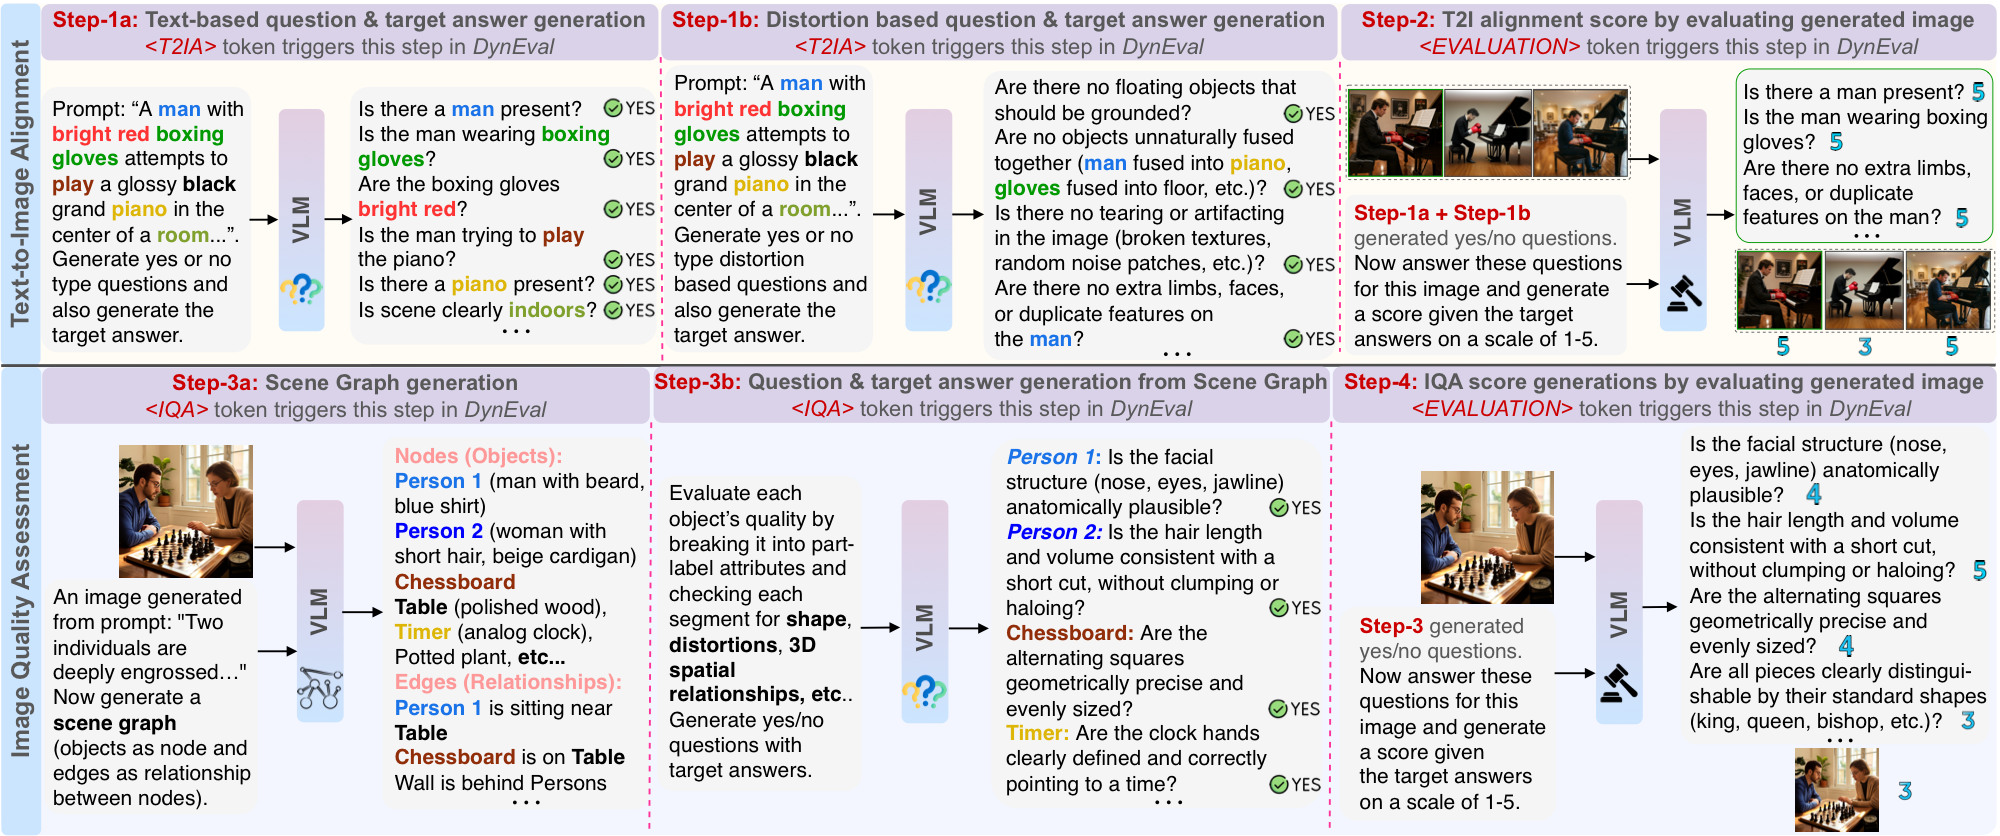
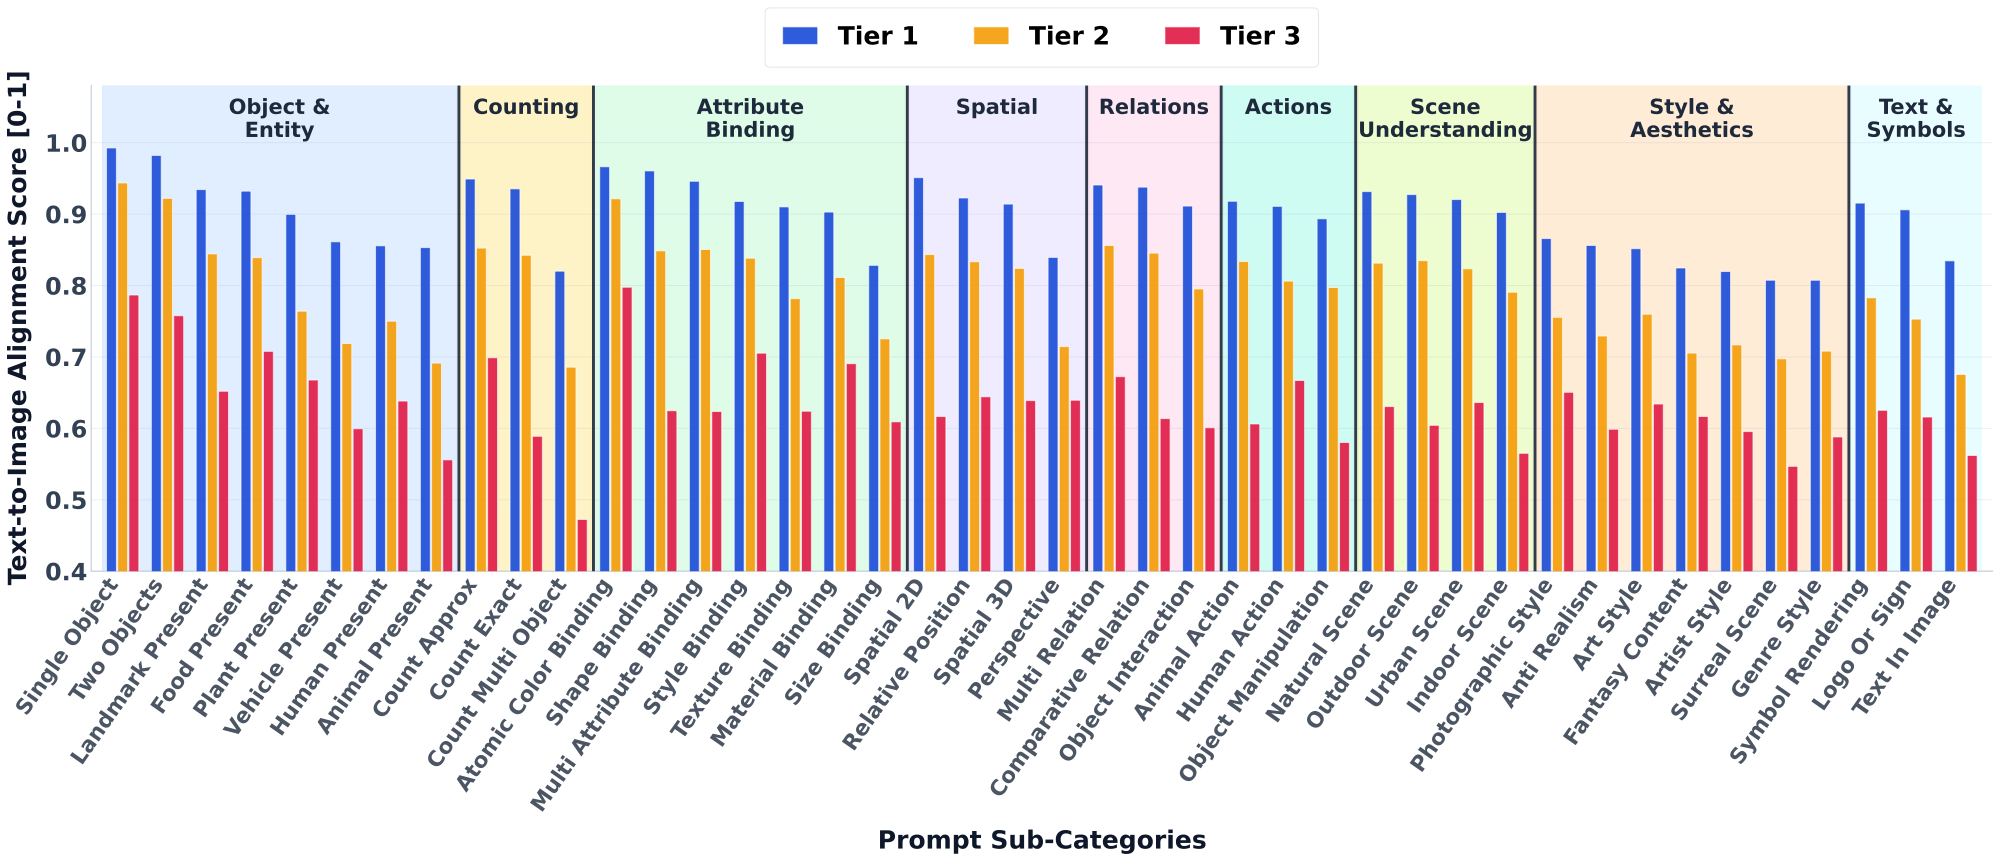
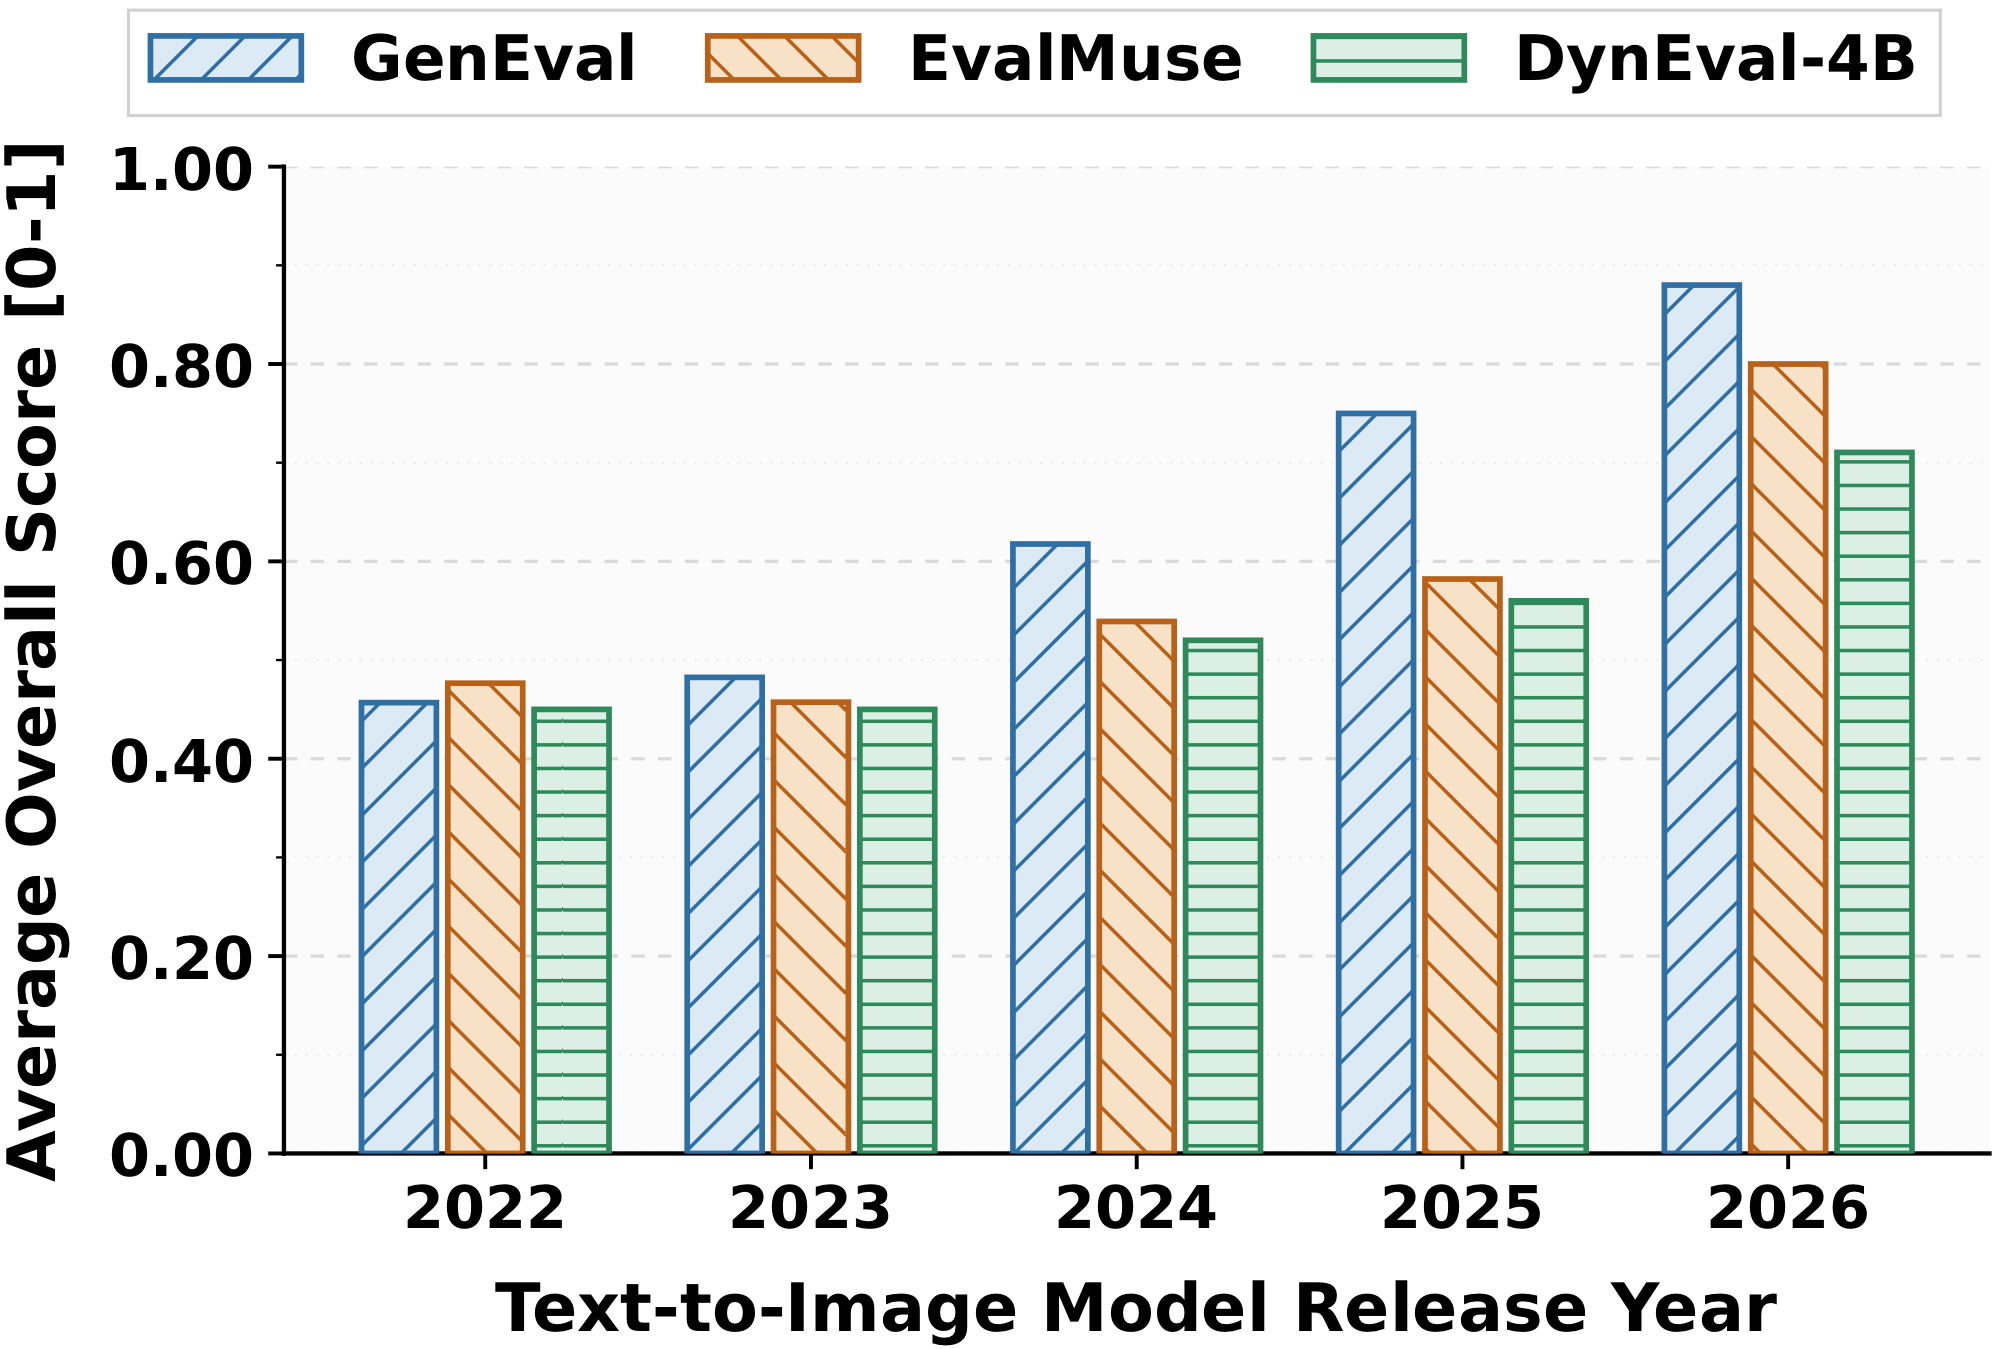
Qualitatively, existing methods such as GenEval, DPG-Bench, EvalMuse, and TIFA often assign high scores to distorted images or deviate from human judgments. DynEval produces more consistent scores because it evaluates both semantic prompt faithfulness and visual quality.
Main Human-Annotated Benchmarks
| Evaluator | EvalMuse | GenAI-Bench | TIFA | RichHF | GenEval | EvalMi | T2I-Eval-Bench |
|---|
| SRCC | PLCC | SRCC | PLCC | SRCC | PLCC | SRCC | PLCC | SRCC | PLCC | SRCC | PLCC | SRCC | PLCC |
|---|
| CLIPScore | 0.2993 | 0.2933 | 0.1676 | 0.2030 | 0.3003 | 0.3086 | 0.0570 | 0.3024 | 0.0654 | 0.0985 | 0.2607 | 0.3072 | 0.0678 | 0.1260 |
| BLIPv2Score | 0.3583 | 0.3348 | 0.2734 | 0.2979 | 0.4287 | 0.4543 | 0.1425 | 0.3105 | 0.2669 | 0.3167 | 0.2900 | 0.3468 | 0.1223 | 0.1321 |
| ImageReward | 0.4655 | 0.4585 | 0.3400 | 0.3786 | 0.6211 | 0.6336 | 0.2747 | 0.3291 | 0.4149 | 0.4603 | 0.4991 | 0.5523 | 0.1349 | 0.1144 |
| PickScore | 0.4399 | 0.4328 | 0.3541 | 0.3631 | 0.4279 | 0.4342 | 0.3916 | 0.4133 | 0.2787 | 0.3015 | 0.4611 | 0.4692 | 0.2375 | 0.2440 |
| HPSv2 | 0.3745 | 0.3657 | 0.1371 | 0.1693 | 0.3647 | 0.3804 | 0.1871 | 0.2577 | 0.3223 | 0.3580 | 0.5336 | 0.5525 | 0.2916 | 0.2990 |
| VQAScore | 0.4877 | 0.4841 | 0.5534 | 0.5175 | 0.6951 | 0.6585 | 0.4826 | 0.4094 | 0.5057 | 0.5040 | 0.6062 | 0.6118 | 0.3348 | 0.3570 |
| GenEval | - | - | - | - | - | - | - | - | 0.4753 | 0.4509 | - | - | - | - |
| FGA-BLIP2-OS | 0.7742 | 0.7722 | 0.5637 | 0.5673 | 0.7604 | 0.7442 | 0.5123 | 0.5455 | 0.5170 | 0.5278 | 0.6724 | 0.6945 | 0.3582 | 0.3471 |
| TIIF-Bench | - | - | 0.4387 | 0.4020 | 0.6007 | 0.5776 | 0.4342 | 0.4292 | 0.5600 | 0.5447 | 0.4474 | 0.4256 | 0.3297 | 0.3016 |
| T2I-Eval-Bench | - | - | 0.4996 | 0.4773 | 0.6011 | 0.6246 | 0.5033 | 0.4990 | 0.5847 | 0.5610 | 0.4258 | 0.4075 | 0.3744 | 0.3629 |
| UniGenBench++ | - | - | 0.4605 | 0.4441 | 0.6078 | 0.5892 | 0.5333 | 0.5172 | 0.5661 | 0.5494 | 0.4611 | 0.4554 | 0.3971 | 0.3818 |
| T2I-CoReB (8B) | - | - | 0.4614 | 0.4414 | 0.6126 | 0.6112 | 0.6024 | 0.5809 | 0.5626 | 0.5810 | 0.5583 | 0.5414 | 0.4035 | 0.3879 |
| GenEval 2 (8B) | - | - | 0.4817 | 0.4571 | 0.6824 | 0.6734 | 0.6311 | 0.6021 | 0.6044 | 0.6175 | 0.7245 | 0.7098 | 0.4222 | 0.4172 |
| LongT2IBench | - | - | 0.3747 | 0.3763 | 0.6775 | 0.6922 | 0.5174 | 0.5161 | 0.4544 | 0.5999 | 0.5056 | 0.5485 | 0.4781 | 0.4563 |
| DynEval-2B | 0.7765 | 0.7798 | 0.5715 | 0.5695 | 0.7827 | 0.7715 | 0.5226 | 0.5545 | 0.5668 | 0.5820 | 0.7346 | 0.7156 | 0.4535 | 0.4410 |
| DynEval-4B | 0.7932 | 0.7945 | 0.5945 | 0.5817 | 0.8022 | 0.8034 | 0.5457 | 0.5691 | 0.5894 | 0.6073 | 0.7944 | 0.7889 | 0.4857 | 0.4636 |
Additional Zero-Shot Benchmarks
| Evaluator | GenEval2 | TIIF-Bench | UniGenBench++ | T2I-CoReBench |
|---|
| SRCC | PLCC | SRCC | PLCC | SRCC | PLCC | SRCC | PLCC |
|---|
| VQAScore | 0.6223 | 0.5208 | 0.3728 | 0.3353 | 0.3109 | 0.2991 | 0.2469 | 0.2668 |
| FGA-BLIP2-OS | 0.3868 | 0.3750 | 0.3581 | 0.4437 | 0.3521 | 0.3457 | 0.3154 | 0.3075 |
| TIIF-Bench | 0.3432 | 0.3322 | 0.3917 | 0.3690 | 0.3254 | 0.3111 | 0.3602 | 0.3562 |
| T2I-Eval-Bench | 0.3904 | 0.3862 | 0.3392 | 0.3190 | 0.3473 | 0.3356 | 0.3811 | 0.3767 |
| UniGenBench++ | 0.4602 | 0.4072 | 0.4788 | 0.4553 | 0.3888 | 0.3752 | 0.3671 | 0.3454 |
| T2I-CoReB (8B) | 0.4813 | 0.4955 | 0.5196 | 0.5671 | 0.4004 | 0.3849 | 0.4469 | 0.4352 |
| GenEval2 (8B) | 0.7120 | 0.7017 | 0.5495 | 0.6028 | 0.4102 | 0.3858 | 0.4435 | 0.4315 |
| DynEval-4B | 0.7508 | 0.7132 | 0.5980 | 0.6298 | 0.4958 | 0.5042 | 0.4856 | 0.4716 |
DynEval-4B achieves state-of-the-art performance on 9 of 11 benchmarks and ranks second on one additional benchmark. Averaged across all benchmarks, it improves over previous best evaluators by +4.77%, and the relative gain rises to +7.61% on benchmarks where it sets a new state of the art. The largest gains occur on EvalMI (+9.65%), GenAI-Bench (+5.46%), UniGenBench++ (+20.87%), and TIIF-Bench (+8.83%). On RichHF and GenEval, DynEval-4B trails larger 8B evaluators while using roughly half as many parameters.
Scaling from DynEval-2B to DynEval-4B consistently improves performance across the main benchmarks, with an average relative SRCC gain of +4.62%. The largest improvements appear on EvalMI (+8.14%) and T2I-Eval-Bench (+7.10%), while smaller but consistent improvements also appear on EvalMuse (+2.15%).
Dynamic Question Generation
DynEval-4B generates IQA questions whose count scales with scene complexity. For images with 1-5 objects it generates 14.2 questions on average, increasing to 66.6 questions for 16-20 objects. Coverage ratio and BERTScore against the Qwen3-VL-235B teacher remain high, showing that the student preserves much of the teacher's question coverage and semantic intent.
Supplementary details, ablations, and additional qualitative figures