DynEval: Supplementary Results

Benchmark details, prompt/model tiering, ablations, and additional qualitative/failure-analysis figures.

Back to project page

Additional Qualitative Comparisons

Additional qualitative comparisons extending main Fig. 1

These supplementary examples extend the main teaser comparison between DynEval and representative T2I evaluation methods including GenEval, TIFA, DPG-Bench, and EvalMuse. All scores are normalized to [0, 1]. The examples show that semantic-alignment methods can assign similar scores to images with substantially different perceptual quality, while DynEval tracks human judgment more closely by combining text-image alignment with image quality assessment.

Benchmark Dataset Details

DynEval is evaluated on 11 benchmarks spanning compositional reasoning, attribute binding, long-form instruction following, multi-object interaction, text and symbol rendering, spatial reasoning, human preference evaluation, and fine-grained text-image alignment. Prompt length is measured in characters including whitespace and punctuation.

Benchmark# Prompts# PairsPrompt Length MinMaxMean +/- StdImages/T2I# T2I
T2I-CoReBench1,0804,3202382,064764.62 +/- 324.511,0804
TIIF-Bench5292,216272,478358.75 +/- 387.445544
UniGenEval++6003,58764300158.60 +/- 33.81Mixed6
LMM4LMM / EvalMI2,08610,080161,87698.26 +/- 145.3242024
RichHF49395541,01879.31 +/- 110.69-3
EvalMuse98910,796633568.62 +/- 45.04Mixed20
GenAI-Bench1,6009,6001419267.42 +/- 26.891,6006
TIFA1608001318256.13 +/- 26.901605
T2I-Eval-Bench8,7728,7722521754.19 +/- 12.54Mixed3
GenEval28003,200139350.82 +/- 18.418004
GenEval1001,200165431.19 +/- 9.464003

For GenEval2, TIIF-Bench, UniGenBench++, and T2I-CoReBench, the supplement describes a unified human annotation protocol. Prompts are decomposed into atomic semantic attributes, annotators label whether each attribute is satisfied, and the final human score is the average binary attribute label in [0, 1].

Prompt Complexity and Tiering

GenDB samples from 1.8M DiffusionDB prompts using a heuristic complexity score over nine factors: prompt length, object/attribute counts, compositional density, artist/style attribution patterns, technical rendering and fidelity terminology, explicit detail descriptors, high-level style keywords, color specifications, and interaction or relational expressions. Prompt length and object/attribute counts receive weight 0.2; the remaining seven semantic factors receive weight 0.1. Prompts shorter than 30 characters are removed.

The selected 500K prompts are divided into tiers with \(\tau_1=200\) and \(\tau_2=100\): Tier-1 hard prompts satisfy \(H(p) \ge 200\), Tier-2 medium prompts satisfy \(100 \le H(p) < 200\), and Tier-3 easy prompts fall below 100. Prompts are also categorized into 9 semantic dimensions and 42 subcategories using multi-label category assignment.

TierRepresentative Prompts
Tier-1Long, compositionally rich prompts such as an astronaut-helmet portrait in the style of Norman Rockwell; a detailed office scene with a girl petting a cat; and a cinematic closeup of school friends in a ski cafe with style, fashion, and composition constraints.
Tier-2Moderate prompts such as futuristic mansion concept art, a puppet-string theater illustration, and a teddy bear in business casual clothing on a couch.
Tier-3Shorter prompts such as a sad person surrounded by books, a dark painting of a couple looking at each other, and a puffin eating pastry in a diner.

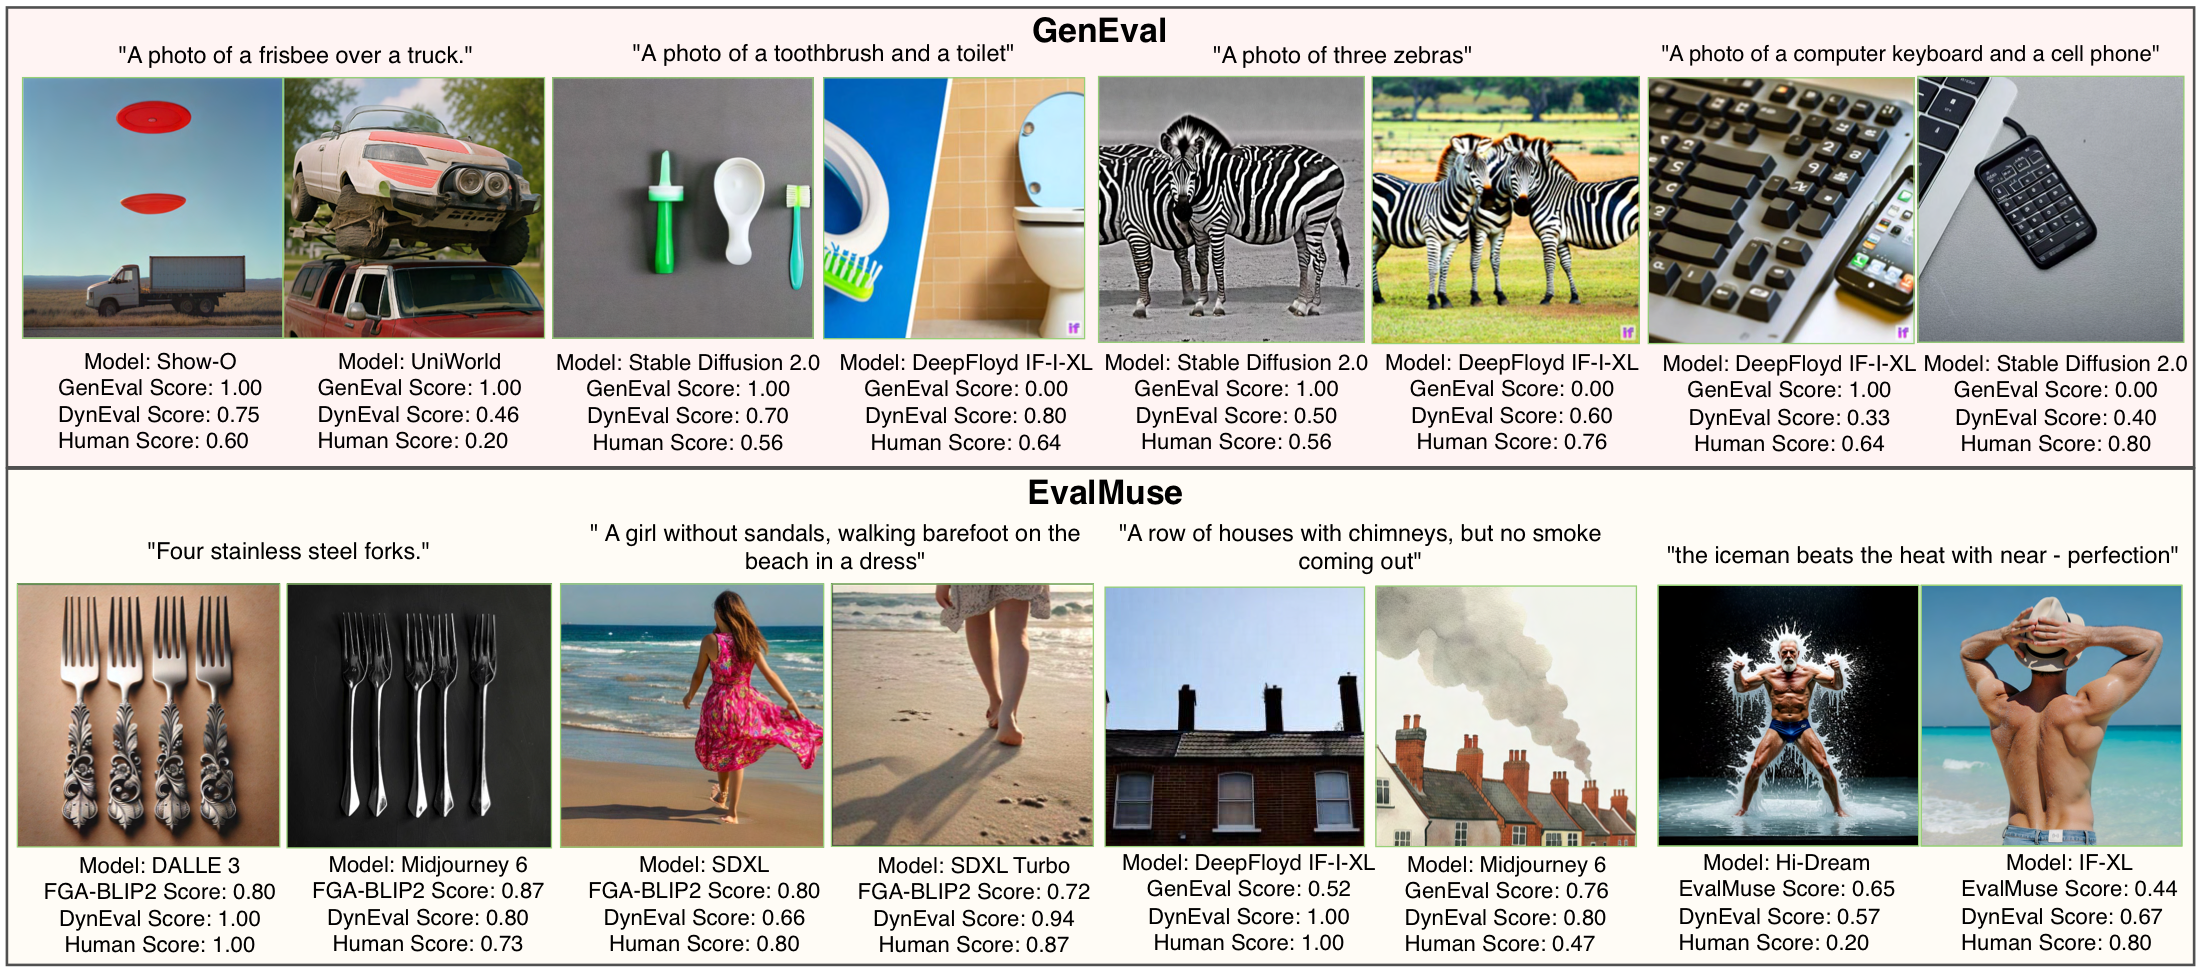
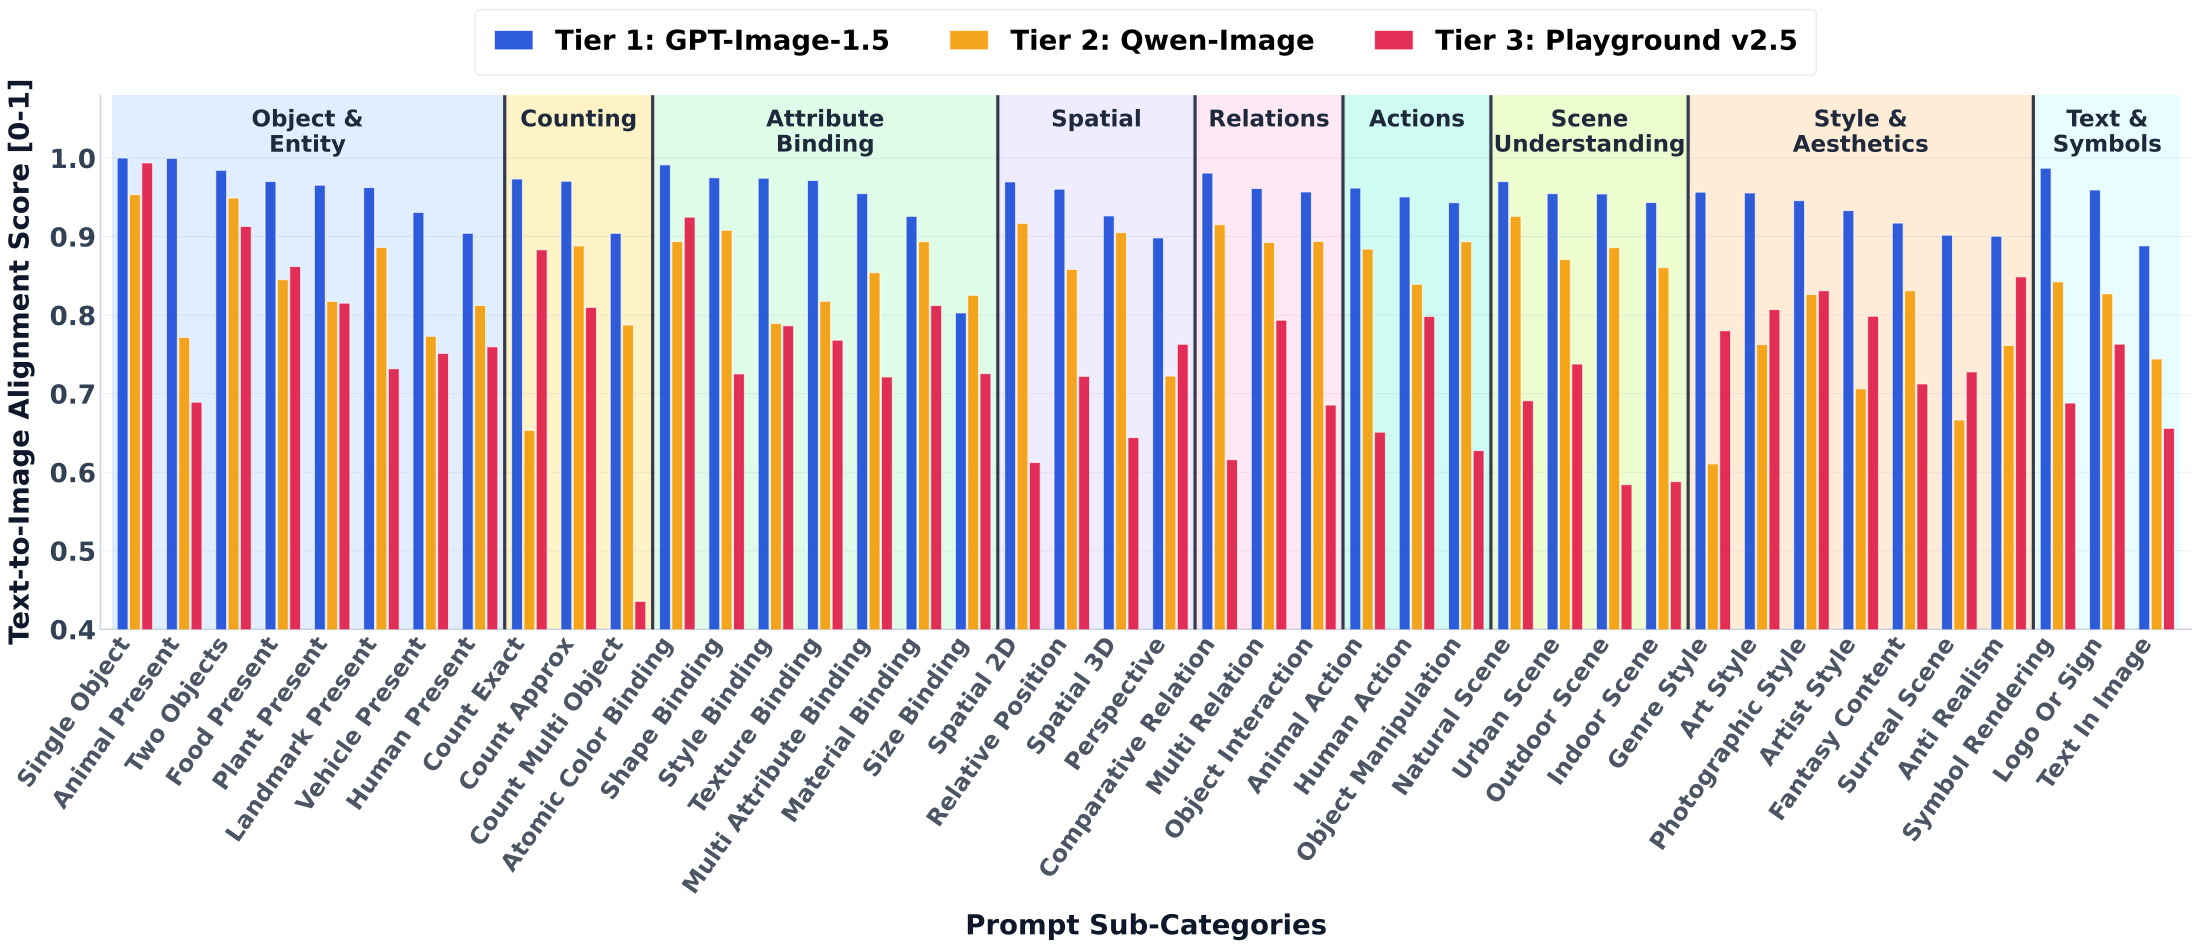
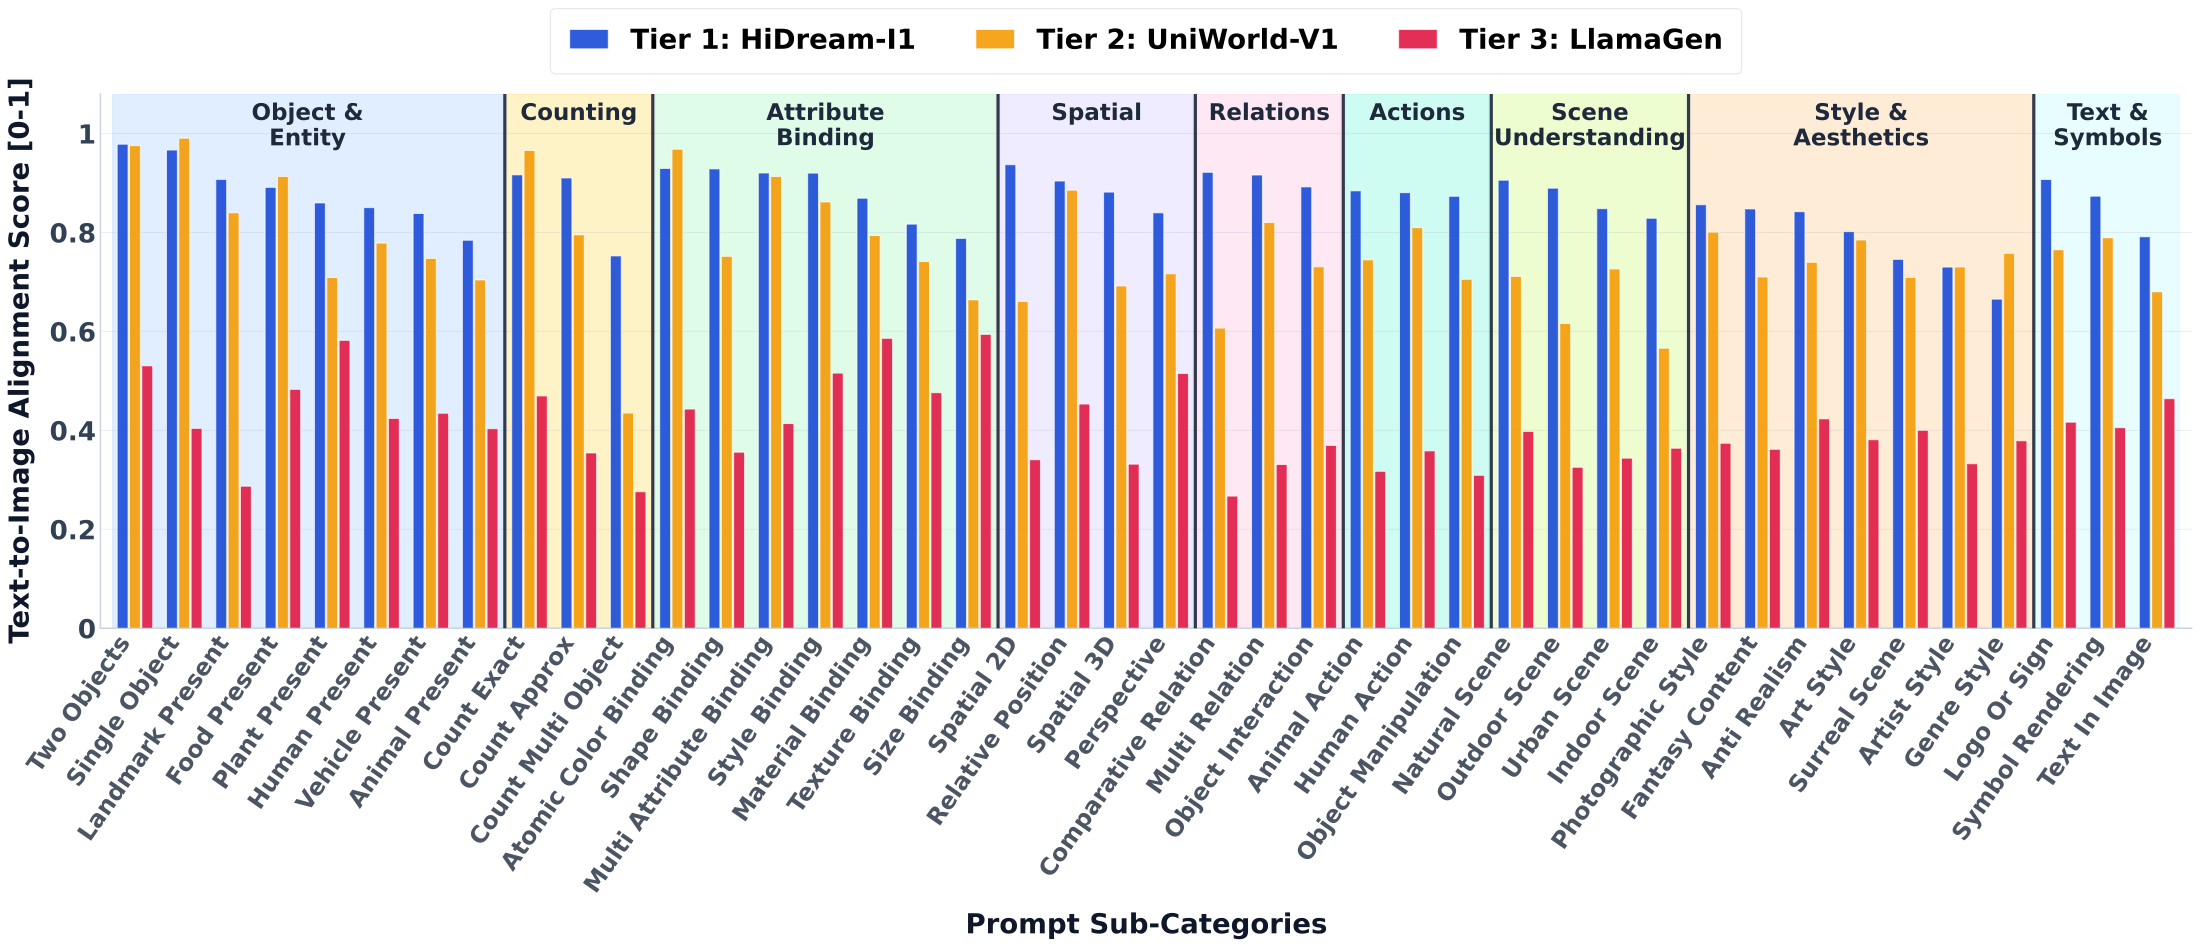
Representative semantic categories include Object and Entity, Attribute Binding, Counting, Spatial, Relations, Actions, Scene Understanding, Text and Symbols, and Style and Aesthetics. Example subcategories include human present, animal present, atomic color binding, material binding, exact count, 2D spatial relation, object interaction, text in image, logo/sign rendering, fantasy content, and surreal scene.

T2I Model Pool and Tiering

DynEval uses 36 T2I models spanning 2022-2026, including early diffusion models, diffusion transformers, autoregressive image generation models, unified multimodal generators, recent open-source foundation models, and closed-source systems. Each model is evaluated on DynEval-1K, which contains 1,000 prompts covering 42 subcategories across 9 semantic dimensions.

TierAverage +/- StdModels and DynEval Scores
Tier-10.872 +/- 0.041GPT-Image-1.5 0.934; NanoBanana 0.915; FLUX.2-klein 0.883; FLUX.2-dev 0.866; FIBO 0.844; LongCat-Image 0.834; HiDream-I1 0.830.
Tier-20.739 +/- 0.039Qwen-Image 0.793; Z-Image 0.789; GLM-Image 0.780; FLUX.1-dev 0.776; Sana 0.769; UniPic 0.768; Stable Diffusion 3.5 0.767; OmniGen2 0.765; In-Context LoRA 0.757; Bagel 0.755; OmniGen 0.741; Hunyuan-DiT 0.727; Show-o 0.711; X-Omni 0.706; Janus-Pro 0.696; Kolors 0.689; PixArt-alpha 0.685; Kandinsky 3 0.683; UniWorld-V1 0.682.
Tier-30.528 +/- 0.123Playground v2.5 0.655; SSD-1B 0.613; DeepFloyd IF-XL 0.609; Emu3 0.597; SDXL-Turbo 0.594; Stable Diffusion XL 0.553; Stable Diffusion v2.1 0.523; Stable Diffusion v1.5 0.475; PixArt-sigma 0.425; LlamaGen 0.240.

Tiering supports tier-matched GenDB construction: Tier-1 models are paired with hard prompts, Tier-2 with medium prompts, and Tier-3 with easy prompts. This avoids wasting compute on trivially good outputs from strong models or catastrophic outputs from weak models on overly hard prompts, and produces richer failure cases for evaluator training.

DynEvalInstruct Curation Thresholds

Teacher-generated T2IA and IQA scores are combined as \(S = 0.5 S_{\mathrm{T2IA}} + 0.5 S_{\mathrm{IQA}}\). Although the curation framework supports tier-specific thresholds \(\delta_i\), the implementation sets \(\delta_1=\delta_2=\delta_3=5\). Since 5 is the maximum possible score, this removes only near-perfect examples and retains samples with semantic, compositional, or perceptual discrepancies. Applying this filter to GenDB yields the final 250K DynEvalInstruct dataset.

Additional Ablations

Teacher Model Selection

The supplement selects the teacher by preferring a stricter evaluator on DynEval-1K. Lower scores indicate more willingness to penalize flawed generations. Qwen3-VL-235B is selected as the teacher because it provides the strongest strict-evaluator behavior among the considered candidates.

Teacher CandidateDynEval Score
GPT-5.20.863 +/- 0.216
Qwen3-VL-235B0.850 +/- 0.192
Qwen2.5-VL-32B0.929 +/- 0.076
InternVL-241B0.900 +/- 0.100
InternVL-78B0.920 +/- 0.084
Qwen3-VL-4B-Instruct0.871 +/- 0.236
Qwen3-VL-8B-Instruct0.971 +/- 0.076

Training Data Scaling

DynEvalInstruct Training DataSRCC
50K0.687 +/- 0.225
100K0.700 +/- 0.178
150K0.750 +/- 0.065
200K0.790 +/- 0.100
250K0.800 +/- 0.025

SRCC improves consistently with more training data and begins to saturate around 250K samples, matching the selected DynEvalInstruct size.

Best and Worst Models Within Each Tier

Best-performing model from each tier across prompt subcategories

Best-performing models from each tier are GPT-Image-1.5, Qwen-Image, and Playground v2.5. Even these models degrade on challenging subcategories such as count multi objects, material binding, outdoor scenes, object manipulation, and text rendering.

Worst-performing model from each tier across prompt subcategories

Worst-performing models from each tier are HiDream-I1, UniWorld-V1, and LlamaGen. The failure patterns are broader and more severe, but exact counting, perspective reasoning, and text rendering remain consistently difficult regardless of overall tier strength.

BibTeX

@InProceedings{marjit_2026_ECCV,
        author    = {Marjit, Shyam and Baiju, Dheeraj and Shikarkhane, Anuj and Sakthieswaran, Akhil and Paul, Sayak and Chakraborty, Anirban},
        title     = {DynEval: Holistic Evaluations of T2I Generative Models in the Wild},
        booktitle = {Proceedings of the European Conference on Computer Vision (ECCV)},
        year      = {2026},
    }